
An Investigation into the Effect of Soaking Duration on the Nutritional Quality of Hay
Download the Soaking Hay research results document here
By Hannah Kruger, Hartpury University, 2022
CHAPTER ONE: INTRODUCTION
The gastrointestinal tract (GIT) of horses is physiologically adapted for a forage-based diet. The presence of symbiotic microbial populations throughout the GIT facilitate fermentation of fibre sources in the large intestine (Dougal et al., 2014; Kauter et al., 2019). The resulting volatile fatty acid (VFA) end products, including acetate, propionate, and butyrate, are primary energy sources which can be converted into both glucose and fat or used directly in various stages of energy pathways (Glinsky et al., 1976; Simmons and Ford, 1991; Vermorel, Martin-Rosset, and Vernet, 1997; Coverdale et al., 2004).
Ryegrass and Timothy grass are the predominant grass seed grown in the UK (Gilliland, Johnston, and Connolly, 2007). These are both C3 forage species, therefore they have high dry matter (DM) digestibility and hold much of their water-soluble carbohydrate (WSC) content in the stem (Longland and Byrd, 2006). Breeding of genotype variations have also increased WSC production in many ryegrass populations (Smith et al., 2001; Evans et al., 2011). Increased availability of energy rich feedstuffs year-round can cause an imbalance between energy expenditure and its supply in the diet (Argo, 2009; Giles et al., 2014; Morrison et al., 2015). This is the primary physiological cause of obesity, which is a major health and welfare concern which predisposes equids to metabolic issues including laminitis, insulin dysregulation and equine metabolic syndrome (McCue, et al., 2015; Rendle et al., 2018). Added weight on internal organs also limits reproductive and performance success (Vick et al., 2006; Dugdale et al., 2011). Equine obesity is a widespread problem in the UK (Robin et al., 2015). Owner reported prevalence tend to be significantly lower than those of industry professionals and researchers (Stephenson et al., 2011; Robin et al., 2015). However, taking this trend into account, studies show an upward tendency in horse numbers effected between 2008 and 2017, values ranging from 27.08% - 72.2% (Wyse et al., 2008; Stephenson et al., 2011; Giles et al., 2014; Robin et al., 2015; Menzies-Gow, Harris, and Elliott, 2017).
Variation in forage quality
Forage quality is determined by the nutritional profile or relative proportions of fractions within the plant structure. The cell content includes protein, sugars, starch, and pectin, while the cell wall is composed of hemicellulose, cellulose, lignin, and insoluble ash. This section is referred to as neutral detergent fibre (NDF) during analysis or can be further deconstructed to acid detergent fibre (ADF) which includes only cellulose and lignin (Soest and Wine, 1967). Digestibility is also often used as a measure of forage quality (Burton, Hart, and Lowrey, 1967; Griffin, Wangsness, and Jung, 1980). Energy availability is directly correlated to digestibility and alters with differing plant maturity levels (Darlington and Hershberger, 1968; Ragnarsson and Lindberg, 2008; Müller, 2011; Muhonen, Sadet-Bourgeteau and Julliand, 2021). Digestibility has been found to have a negative correlation with increasing cell wall components (Edouard et al., 2008; Harris et al., 2017). This is due to the structural rigidity grass species require as they mature in order to support stem elongation (Virkajärvi et al., 2012). Consequently, lignification occurs which involves increasing the concentration of the lignin and hemicellulose matrix within the secondary cell wall (Seppänen et al., 2010). This, along with the cross-linkages with ferulic acid components reduce digestibility of cell wall polysaccharides by impeding microbial access (Grabber et al., 2004; Jung et al., 2012).
Forage quality and availability of nutrients is affected by plant species. Sorensen et al. (2021) found total VFA concentrations in the cecum differed significantly between hay types in a crossover study of fistulated horses on isocaloric diets. VFA absorption was not measured in this study, however, differences in VFA production in the proximal portion of the hindgut is likely to result in differing quantities available for use as an energy source. Darlington and Hershberger (1968) and Vermorel, Martin-Rosset and Vernet (1997) also analysed nutrient profile differences between hay types and found significant differences in digestible energy and metabolizable energy between species, although Martin-Rosset and Vernet (1997) were also feeding varying levels of concentrate feeds which may have altered the digestion of forages.
Forage quality also alters with season, environmental temperature, and management factors. Cool climate species have no self-limiting mechanism for production of fructan and other sugars. Consequently, accumulated WSCs excess of growth requirements are stored (Watts and Chatterton, 2004; Longland and Byrd, 2006). Photosynthesis also causes diurnal variation in WSC stored (Longland, Cairns, and Humphreys, 1999). The sum combination of quality variables determine energy content, digestibility, palatability, and voluntary intake of individual forage sources. Without knowledge-based action determined by energy differences between sources, industry practise will inevitably feed the equine obesity epidemic and lead to a multitude of metabolic disorders.
Impact of soaking hay on water-soluble carbohydrates and weight loss
Diet restriction is one of the primary solutions to weight loss. However, inadequate forage quantities of less than 1.5% bodyweight (BW) reduce gastric health. This is a consequence of changing pH levels through reduced production of saliva which buffers stomach acid. The horse is then predisposed to metabolic disorders such as equine gastric ulcer syndrome particularly when combined with high starch quantities which is typical of the traditional diets of domesticated horses (Richards, Hinch and Rowe, 2006; Burk and Williams, 2008; Luthersson et al., 2009; Stowers et al., 2013). Equine rhabdomyolysis syndrome and colic also have increased risk when forage requirements are not met, although a cause-and-effect relationship cannot be assumed because of lack of control of all confounding variables during research (Hudson et al., 2001; Durham, 2009; Harris and Rivero, 2017).
Frank et al. (2010) recommended non-structural carbohydrate (NCS) levels within hay (determined by combining WSC and starch percentages) should be below 10% to assist weight loss and reduce risk of laminitis and equine metabolic syndrome. Reported NSC levels have ranged from 4.4-30% of total hay content (Francis et al., 2002; Borgia et al., 2011; Rodick and Jones, 2012; Shepherd et al., 2012). However, only Borgia et al. (2011) reported NSC values under 10%. This may also have been linked to the study aim requiring a range of nutritional contents for comparison, rather than being an accurate representation of commonly available forage composition. Soaking forage is the foremost method of procuring NSC levels below 10% in hay which is otherwise too rich in sugars and starch. High WSC levels (>18%) trigger rapid increases in blood plasma glucose levels, release of insulin and subsequent uptake of glucose by cells in the body (Borgia et al., 2011; Shepherd et al., 2012). This is then converted to fat if energy expenditure is insufficient.
There are large variations and inconsistencies in the quantity of nutrients being reduced through soaking in the current literature, most studies focusing on WSC reduction as a method for reducing energy content. Soaking for a duration of between 20mins and 3 hours has been found to result in a WSC reduction of 5-10% (Longland, Barfoot, and Harris, 2011). Blackman and Moore-Colyer (1998) reported significant mineral losses (p<0.001) of K, Mg, and Cu with similar soaking time frames but did not find a significant decrease in WSC content with these durations. Based on these studies the original quality and nutritional composition of hay are the variables that will ultimately determine whether the post-soaked hay is below the 10% NSC levels advised. Longer soaking periods of between 9 and 24 hours have been reported to reduce WSC by 27-70% (Longland, Barfoot, and Harris, 2011; Moore-Colyer et al., 2014; Muller, Nostell, and Bröjer, 2016). The lower portion of this range were the results of studies aiming to replicate industry soaking conditions. This suggests ability to soak forage effectively is circumstantial and based on a combination of available facilities and topical knowledge. This should be considered when both designing experimental conditions and making conclusions of best practise for the lay horse owner. The upper range of results were from research evaluating losses in individual WSCs such as glucose, fructose and fructan. Whole WSC contents may not decrease to this extent, although Muller, Nostell, and Bröjer (2016) reported WSC reduction to be 60% at 24 hours of soaking which equalled 3.8% of total hay content. This study concluded 24 hours to be an unnecessarily lengthy soaking timeframe. However, this may have been because the WSC percentage in the initial pre-soaked hay was already low (9.5%).
The previous research in this topic area utilised differing hay types, water quantities and temperature, and varying methods of analysis, making these variables uncontrolled for between studies. This could impact the repeatability of methods, as these variables will alter the speed at which physical and chemical changes in plant matter occur. Subsequently, these differences are potential reliability and validity limiting factors. Regardless of this, there is general agreement that WSC concentrations have a negative correlation with increased soaking time; soaking management factors and initial nutrient content manipulating the extent.
Nutritional changes in forage are a major influencing factor in the difference in weight loss success between horses on soaked hay versus those provided non-soaked forage. Common nutritional practise for weight loss without soaking includes the removal of concentrate feeds and provision of energy restricted meals, based on percentage BW, of primarily forage (Van Weyenberg et al., 2008; Argo et al., 2012). Bamford et al. (2019) illustrated success of this approach by restricting the diet of 12 obese horses to 1.25% BW on a DM basis and recording a mean percentage BW decrease of 7.7 ± 2.1% over 12 weeks. However, this result was for horses also in an exercise programme. Horses with manipulation of solely the diet had a decreased percentage BW of just 6.2 ± 4.3% although this was still a significant decrease (p<0.001). Gill et al. (2016) investigated the effect of 10-20% restriction of energy requirements, with DM intake also being between 1.25-1.5% BW, and found a decrease of 5.98% BW and 1.4 unit decrease in body condition score (BCS) at the end of the 26-week trial period. Although this protocol did elicit weight loss, the trial period was over the winter months when natural BW decreases tend to occur which raises questions of whether the results would be sustainable in alternate seasons. Some horses were also in intensive management situations with no access to pasture which is not representative of many horses in the obese category within industry who have regular or constant access to grazing.
Argo, Dugdale, and McGowan, (2015) investigated whether feeding soaked hay at 1.25% BW on DM basis resulted in higher weight loss than the same volume in fresh hay as done by Argo et al. (2012). Results showed decreases of 0.98 ± 0.10% of week 1 BW weekly, indicating an estimated 2-fold increase in weight loss compared to dry forage diets. McGowan et al. (2013) also fed soaked hay at 1.25% BW on a DM basis, reporting a mean of 6.8% decrease in body mass over a 6-week period. They also specified soaking in this experiment resulted in a 38% reduction in WSC. Given these results, soaking forage appears to be a more sustainable approach to weight loss than restriction alone. It is also likely to have minimal welfare implications in comparison with other methods which have potential to undermine the role of constant forage in equine GIT health.
Impact of soaking hay on fibre components
There is less literature surrounding the effect of soaking on the structural carbohydrate, fibre portion of forage plants such as ADF and NDF. Argo, Dugdale, and McGowan, (2015) reported a decrease in apparent digestibility of all nutrients as a result of soaking, with the exception of ADF and crude protein (CP) which seemed to increase. These results show agreement with Moore-Colyer et al. (2014) and Mack et al. (2014) who both reported ADF increases. Mack et al. (2014) also suggested NDF increases with soaking. The percentage increases seen are likely to result from both increased fibre concentration and reduction of the non-structural components of forage altering the ratio between structural and non-structural components (Collins, 1991). Fibre sections of forage represent the least digestible components of plant matter. Regardless, they could be valuable figures to know when considering the total energy content and intake of feeds for obese animals, as they may still alter final digestible energy available. Current literature describe a reduced WSC percentage and therefore energy availability after soaking. This suggests the resulting higher ADF and NDF proportions aid reduction in energy supply for obese animals. However, if soaking also increases digestibility of structural portions of plant matter then this could counteract the total energy reduction elicited. Consequently, identifying which timeframes provide the best ratio of nutrients to maximise healthy weight loss could provide a clearer picture of best practise for industry.
Aim, objectives, and hypotheses
The aim of this study was to compare the impact of different soaking periods on DM, NDF, ADF and WSC content of one hay type.
The objectives of this investigation were therefore to:
- Determine median DM content of each 0, 1, 2, 4, 8 and 12 hour-soaked samples, identify if there was a significant difference between any group and if so between which groups.
- Determine median NDF content of each 0, 1, 2, 4, 8 and 12 hour-soaked samples, identify if there was a significant difference between any group and if so between which groups.
- Determine median ADF content of each 0, 1, 2, 4, 8 and 12 hour-soaked samples, identify if there was a significant difference between any group and if so between which groups.
- Determine median WSC content of each 0, 1, 2, 4, 8 and 12 hour-soaked samples, identify if there was a significant difference between any group and if so which groups.
The study hypotheses were therefore:
Null hypothesis: There will be no difference in DM content between different soaking time periods.
Alternative hypothesis: There will be a difference in DM content between different soaking time periods.
Null hypothesis: There will be no difference in NDF content between different soaking time periods.
Alternative hypothesis: There will be a difference in NDF content between different soaking time periods.
Null hypothesis: There will be no difference in ADF content between different soaking time periods.
Alternative hypothesis: There will be a difference in ADF content between different soaking time periods.
Null hypothesis: There will be no difference in WSC content between different soaking time periods.
Alternative hypothesis: There will be a difference in WSC content between different soaking time periods.
CHAPTER TWO: METHODS
The study used a quantitative, cross-sectional design with methods based on studies undertaken by Blackman and Moore-Colyer (1998) and Longland, Barfoot, and Harris (2011). Ethical approval was obtained from the Hartpury University Ethics committee prior to any data collection; ethics reference number ETHICS2021-32-LR. External guidance on best choice of method was gained from Baileys Horse Feeds. Three small hay bales were sourced from the supply already used and available at Hartpury Equine. These were from the same delivery and source to limit differences in quality and grass species between bales. All data collection was performed on the University campus.
Experimental Procedure
The three hay bales were selected from the haybarn at Hartpury Equine via a stratified random sampling approach. The ends of each bale were discarded, as these are likely to have been exposed to different environmental conditions to the rest of the bale before the remaining portion of the bale was divided into three equal sections. Approximately 3kg of hay was then collected from each bale, making sure to include hay from all sections to ensure samples were representative of hay from the entire bale. The 3kg samples from each bale were then combined and mixed as done by Moore-Colyer et al. (2014), before filling three large-holed haynets with 2.8kg of mixed hay each. Shaking hay somewhat loose for mixing was not expected to have an effect on nutrient content (Longland, Barfoot, and Harris, 2011).
Two 50g samples were collected from each haynet for analysis of the pre-soaked hay source. Each sample was clearly labelled with a predetermined code, stored in an airtight plastic bag, and sealed to avoid loss of nutrients before laboratory analysis. Each haynet was then placed in a 40L plastic bucket and then filled to the top with cold tap water to submerge the hay, thus standardising water quantity, and consequently environmental soaking conditions, across all haynets and samples.
Soaking in individual containers is a common approach seen in equine yards as many do not have access to larger soaking devices. This makes this method representative of soaking conditions within the industry (Longland, Barfoot, and Harris, 2014). Each haynet served as an experimental repeat and were labelled A, B and C. All nets were soaked for a period of 12 hours with two samples taken from each net at 1, 2, 4, 8 and 12 hours. Soaking times were chosen to represent the varied common practice of soaking for short periods, between meals during the day or overnight. Previous studies have also made similar choices (Blackman and Moore-Colyer, 1998; Longland, Barfoot, and Harris, 2011; Argo, Dugdale, and McGowan, 2015). Throughout the collection process, water temperature was also measured at each sampling time as Longland, Barfoot, and Harris (2014) found water temperature had a significant influence on quantities of water-soluble carbohydrates lost. A glass laboratory thermometer was used in this process, and measurements were taken at multiple points in the buckets in order to be representative of the entire water volume.
At each sampling time, haynets were removed from the water one at a time, starting with haynet A, and allowed to drain for a brief period of 2 minutes before being weighed with a portable hanging scales, providing a comparison of its pre-soak weight to determine water absorption capacity. Two 100g samples of wet hay were then collected from the middle and bottom of the net and placed in small foil containers. The haynet was then replaced into its original water bucket and samples were cut into 3 to 6-cm-long pieces before reweighing to ensure standardised and correct weight. This process was repeated with each haynet, in the same order each time, to ensure standardisation of soaking times. Wet hay samples were increased to 110g at the two- hour sampling period as the haynets were found to have high water holding capacity and laboratory specifications required sample size to be a minimum of 50g on an air- dried basis. Weighed off sample amounts at time of collection also conformed to those of Longland, Barfoot and Harris (2011) which allows for easier comparison. However, they were considerably smaller than samples taken by Argo, Dugdale, and McGowan, (2015).
Weighed and cut wet samples were taken to a laboratory on the University campus and received a combination of oven drying at 50°C and air drying at room temperature in the laboratory over a period of 4 days. Air drying was proposed by external advisors to prevent mould spores from developing while in transit to laboratories. However, because of the cold climate at time of collection, oven drying was also required to complete adequate drying. Once dry, samples were again reweighed and then packaged in the same way as dry samples. One set of samples from each haynet and soaking time were sent to Homes Laboratory in Ohio (USA) for wet chemical analysis to determine DM, NDF and ADF. The other set of samples were sent to Sciantec Analytical (UK) for determination of WSC using standard laboratory procedures.
Statistical Analysis
On receipt of results, collected data was input onto Microsoft Excel for compilation and run through SPSS (IBM, version 26) for analysis of results. Descriptive statistics were done first to establish medians for each sample group (samples being grouped according to time soaked). Data was then tested for normal distribution using a Shapiro Wilks test because of the small sample size. The majority of data was found to be parametric, however three values were non-parametric (See appendix f) As this raised questions as to whether the data conformed to the assumptions made by parametric tests of difference, non-parametric tests which make no assumptions about sample distribution were used (Dytham, 2010). Consequently, a Friedman’s 2-way ANOVA by ranks test was run to determine if there was a significant difference in DM, NDF, ADF and WSC values between any sample group. This test was chosen because of the relatedness between samples within the investigation (Fields, 2017). A 95% confidence interval was assumed, therefore p<0.05 equalled a significant result. Once a significant difference was identified, pairwise comparisons were performed using a post hoc test in order to further distinguish between which groups the difference was found. A Bonferroni adjustment was used to correct errors from running multiple tests. Data from hours 0 and 1, 2 and 4, and 8 and 12 were also combined respectively and Friedman’s 2-way ANOVA by ranks tests run again in order to gain more detailed insight into changes in nutritional composition through time.
Ethical consideration
This project made no use of living subjects or participants and subsequently raised limited ethical issues. The primary consideration was that of data security. All data was stored in accordance with university guidelines on a Hartpury University OneDrive account in order to reduce risk of file corruption.
CHAPTER THREE: RESULTS
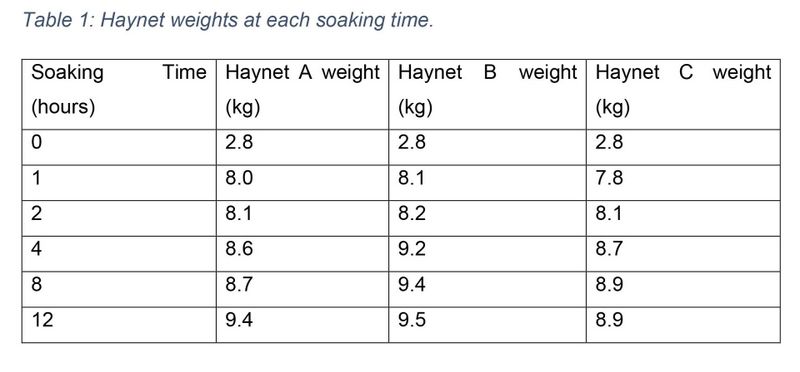
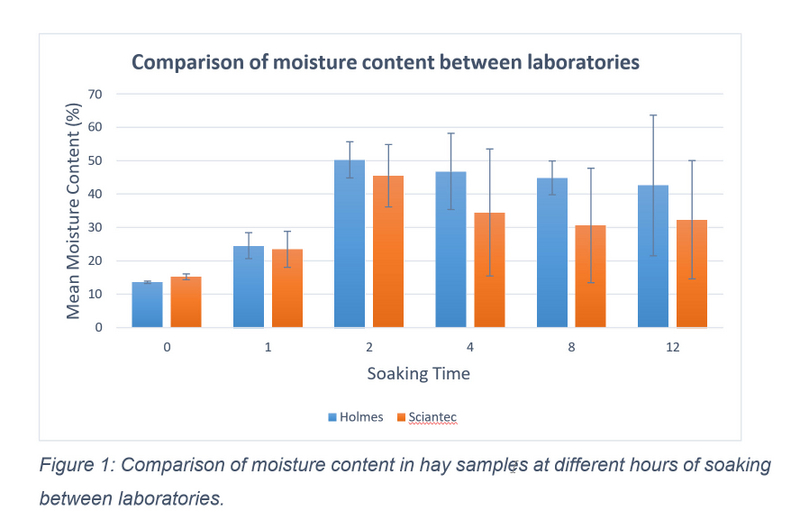
Minor temperature changes were recorded throughout the soaking period, with water temperature ranging from 4-6°C during the day. Haynet weight increased as water was absorbed (see table 1). Despite sample weights conforming to exactly 100g or 110g at collection, variations in drying resulted in dried samples being between 25- 55g when reweighing pre-packaging. This did not affect laboratory ability to run all necessary tests. As WSC was the only nutritional component analysed by a separate laboratory, a comparison of moisture content between the two laboratories was conducted to ensure consistency of results. Sciantec Analytical (UK) provided a moisture value alongside results, while moisture content for each Homes Laboratory sample was calculated using the equation (m = 100 - d) where m equals the moisture content and d equals the reported DM value for the sample. Moisture content data was found to be parametric using a Shapiro Wilks test, therefore a Pearson’s correlation was performed. A significant relationship between the moisture content of Holmes and Sciantec results was found, r = 0.719, p = 0.001 (see figure 1).
 DRY MATTER CONTENT BETWEEN SOAKING TIME
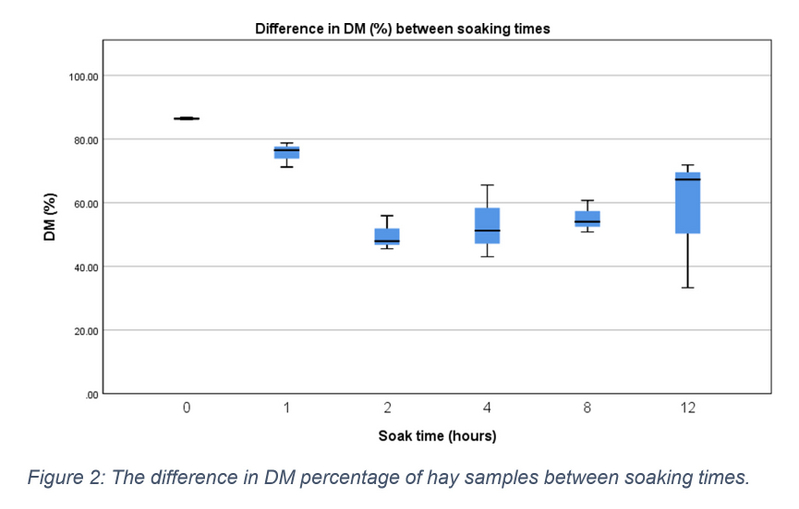
DM content was measured as a percentage of total sample content. The median DM of pre-soaked hay samples (0 hours) was 86.390 (IQR = 86.100 - 86.790). DM values decreased during the soaking period (see figure 2), although this decrease was found to be non-significant (X2(5) = 11.000, p = 0.051). The mean percentage difference of DM between each soaking time and the pre-soaked hay samples is shown in table 2. Despite lack of significant results, when combining the data into three soaking time groups, a significant decrease was found, X2(2) = 9.333, p = 0.009. Post hoc pairwise comparisons found this significance to be between the DM content at the start of soaking (0-1 hours) and mid-way through the soaking period at 2-4 hours (p = 0.012).
Neutral and acid detergent fibre content between soaking times
NDF and ADF content were measured as a percentage of total sample content on both an as sampled (AS) and DM basis. On an AS basis the median NDF content of 0-hour samples was 56.880 (IQR = 52.680 – 60.550), this increased to 65.840 (IQR = 61.190 – 69.770) on a DM basis. Distribution differences in AS NDF content between soaking time periods is shown in figure 3, however none of these differences were statistically significant, X2(5) = 10.810, p = 0.055. On a DM basis there was a significant upwards tendency within descriptive data (X2(5) = 11.762, p = 0.038), which was also seen in percentage increases between time periods and pre-soaked hay (see Table 2). Medians ranged from 72.470 (IQR = 71.170 – 72.860) at 1 hour of soaking to 75.110 (IQR = 74.780 – 75.430) at 12 hours (see figure 4). Nonetheless following pairwise comparisons and Bonferroni correction, adjusted values were all non- significant (p>0.05). Reorganising NDF data into three soaking time groups, a significant difference was again found, X2(2) = 10.333, p = 0.006. Further testing revealed a significant difference between the 0- and 1-hour data group and 8- and 12- hour data group (p = 0.004). No significant difference was found between any other group.
On an AS basis the median ADF value of 0-hour samples was 36.860 (IQR = 32.880 – 39.780). Changes reported on an AS basis are presented in figure 5 and were found to be non-significant (X2(5) = 9.667, p = 0.085). Conversely, on a DM basis median values ranged from 42.670 (IQR = 38.190 – 45.840) at hour 0 to 48.380 (IQR = 48.030 – 49.260) at hour 12 (see figure 6). Mean percentage difference showed a gradual increase in ADF quantities which peaked at 15.57% at hour 12 (see table 2). A significant increase was found between the different soaking points X2(5) = 11.571, p= 0.041, however, no significant pairwise comparisons were identified. Pooling data into three soaking time groups once again resulted in a significant difference (p = 0.004). Post hoc testing identified this significant increase to be between samples taken at the start of soaking (0-1 hours) and those taken in the later stages of soaking (8-12 hours).
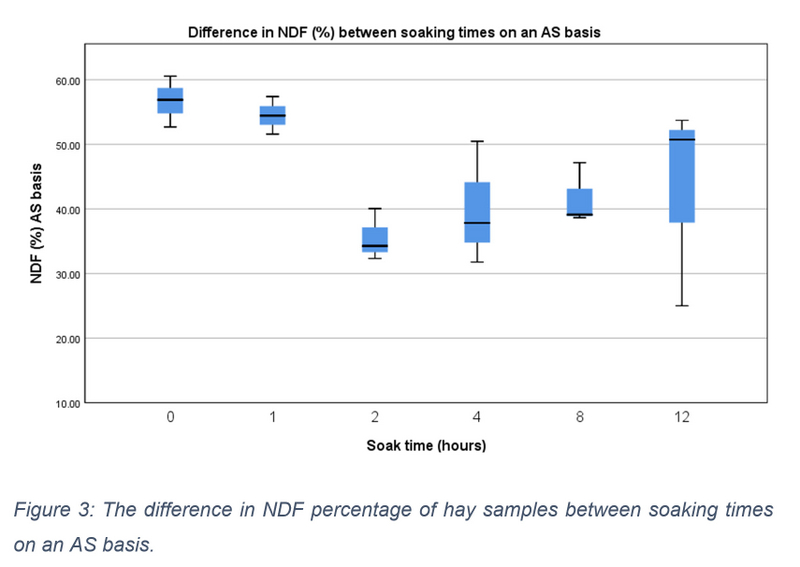
Figure 3: The difference in NDF percentage of hay samples between soaking times on an AS basis.
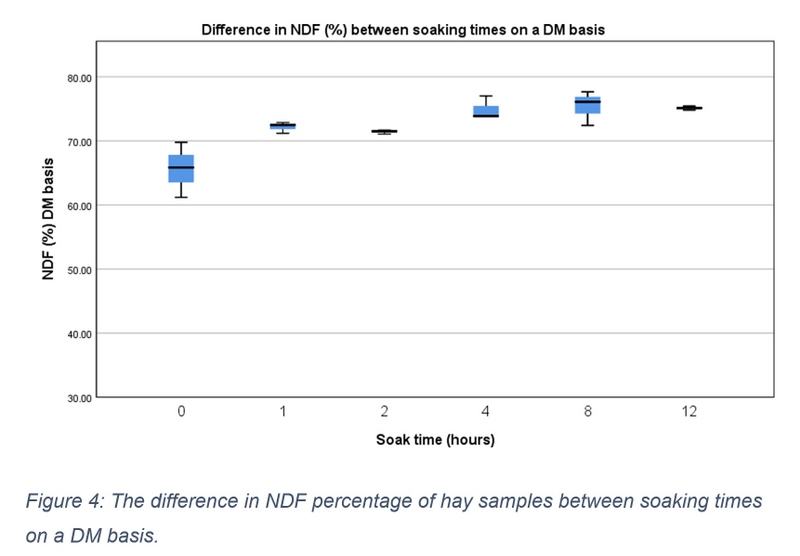
Figure 4: The difference in NDF percentage of hay samples between soaking times on a DM basis.
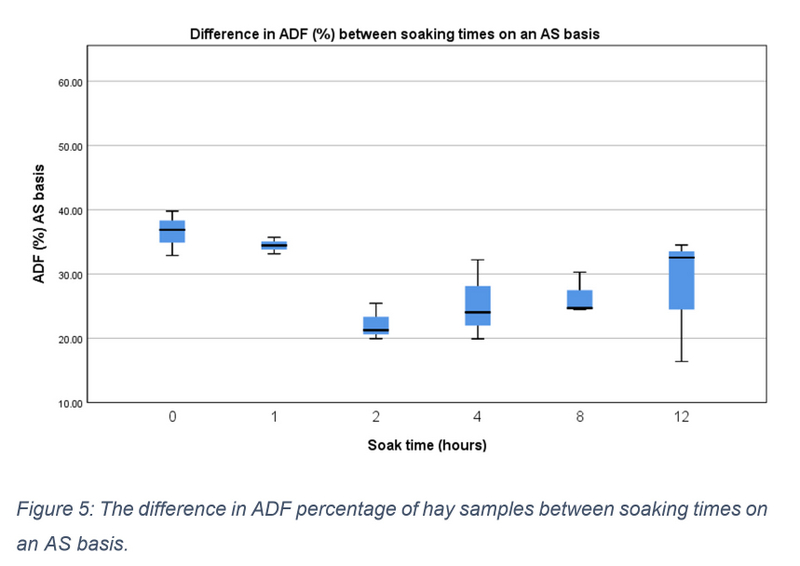
Figure 5: The difference in ADF percentage of hay samples between soaking times on an AS basis.
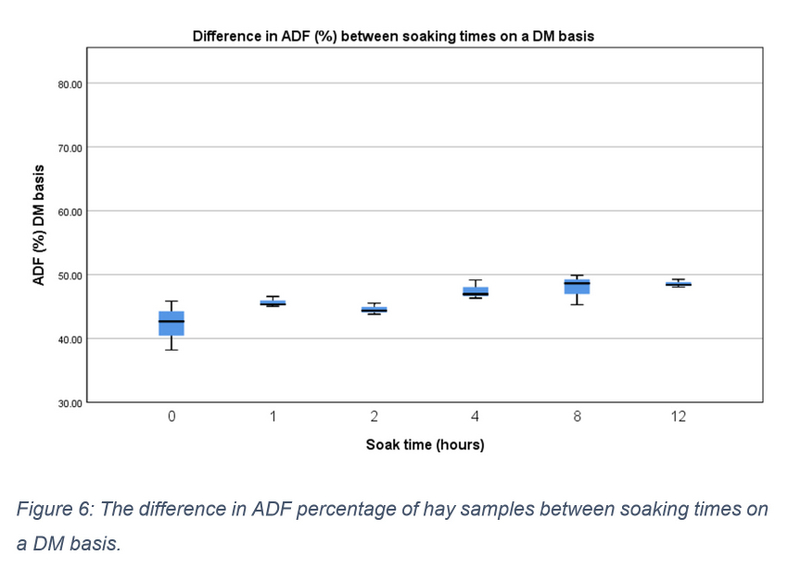
Figure 6: The difference in ADF percentage of hay samples between soaking times on a DM basis.
Water-soluble carbohydrates between soaking times
WSC content was measured in grams per kilogram (g/kg) on a DM basis. The data range followed a downward trend with increasing soaking time. The median WSC level of pre-soaked hay samples (0 hours) was 167.700 (IQR = 105.500 – 202.700). This decreased to 81.500 (IQR = 76.800 – 125.400), 101.500 (IQR = 97.700 – 113.200), 104.900 (IQR = 92.800 – 116.300), 75.100 (IQR = 73.800 – 85.200), and 71.600 (IQR = 67.700 – 101.000) at 1, 2, 4, 8, and 12 hours respectively (see figure 7). There was a statistically significant difference in WSC content between these time periods, X2(5) = 11.571, p = 0.041.
However pairwise comparisons revealed no significant differences between any paired variables (p>0.05). Combining data from hours 0 and 1, 2 and 4, and 8 and 12 a significant difference was once again found X2(2) = 9.000, p = 0.011. Further analysis using post hoc tests with adjusted significance found significant decreases between the 0- and 1-hour data group and 8- and 12-hour data group (p = 0.028), and 2- and 4-hour data group and 8- and 12-hour data group (p = 0.028).
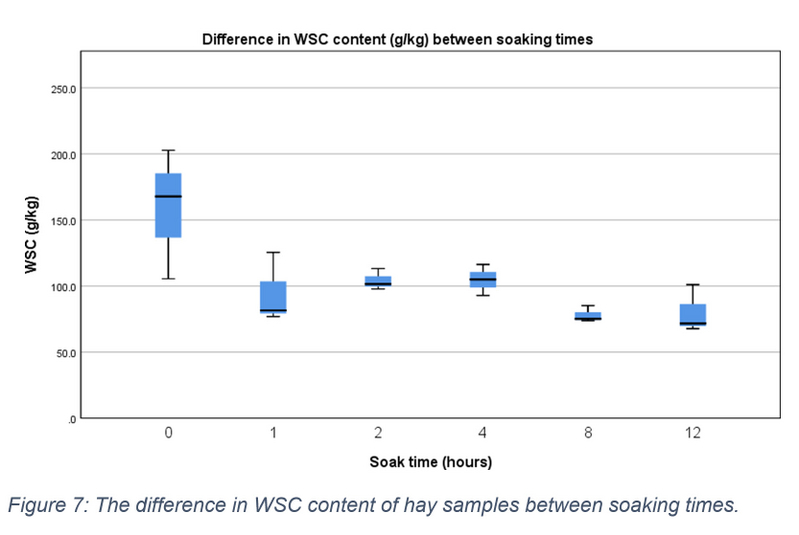
Figure 7: The difference in WSC content of hay samples between soaking times.
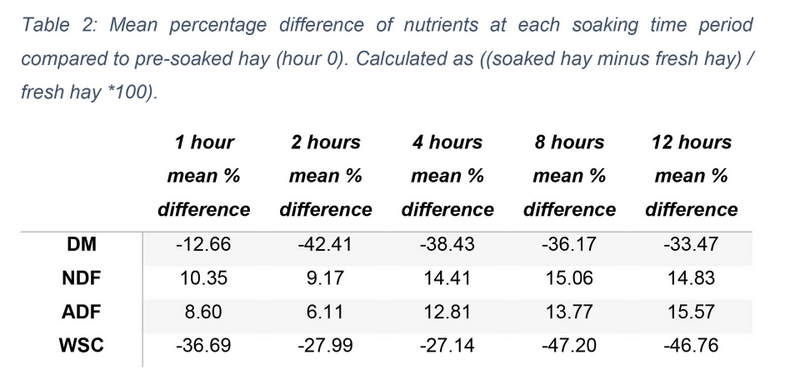
Table 2: Mean percentage difference of nutrients at each soaking time period compared to pre-soaked hay (hour 0). Calculated as ((soaked hay minus fresh hay) / fresh hay *100).
CHAPTER FOUR: DISCUSSION
The aim of the study was to compare the impact of different soaking periods on DM, NDF, ADF and WSC content of hay in order to identify best practise for effective weight loss in obese equids. The objectives were to determine median DM, NDF, ADF and WSC content of each 0, 1, 2, 4, 8 and 12 hour-soaked samples and identify if there was a significant difference between any groups. Overall significant changes to the nutrient content of the forage were determined and hypotheses accepted and rejected accordingly.
Soaking effect on dry matter content
A percentage decrease of between 12.66 and 42.41% was found in the DM results of soaked hay in the current study (see table 2). When analysed as individual soaking times no groups were found to have significant differences, however when pooled into groups of similar timeframes a significant decrease was found between the 0- and 1- hour data group and the 2- and 4-hour data group (p = 0.012). Consequently, the alternate hypothesis was accepted, and the null hypothesis rejected. These findings are much lower than results of several previous studies which reported far greater percentage decreases of between 72.06-81.02% when soaking hay for 3-16 hours (Longland, Barfoot, and Harris, 2011; Argo, Dugdale, and McGowan, 2015; Muller, Nostell, and Bröjer, 2016). This is somewhat surprising considering the median DM value of fresh, pre-soaked hay (86.39%) was within the range of those reported by these studies (82.70%, 87.34 and 84.30% respectively) and the soaking times were also comparable. One explanation for these differences could be variation in the quantity of water per kg of hay effecting water absorption levels. Longland, Barfoot, and Harris (2011) soaked 2kg sections of hay in 65L tubs containing 24L of water and reported haynets weighed 4.4 times their fresh weight after just 20mins of soaking. Haynets in the current study were soaked in smaller tubs (40L), and although exact water quantity is unknown, haynets were of similar size, so water quantity is likely to have been lower. Regardless, absorption increased with time (see table 1). Haynets weighed a mean of just 9.27±0.32kg at 12 hours of soaking which equates to 3.3 times their original weight, however when considering the 1.28kg of hay removed as samples, the weight increase is 6.1 times the DM weight.
The lack of significant differences between the original soaking time groups could be a consequence of the smaller sample population compared to those of much of the available literature (Blackman and Moore-Colyer, 1998; Longland, Barfoot, and Harris, 2011; Muller, Nostell, and Bröjer, 2016). Fewer samples result in a wider confidence interval and more value being placed on each individual sample result (Hackshaw, 2008). The quantity of hay being soaked may also have been an influencing factor. Argo, Dugdale, and McGowan (2015) conducted both soaking of haynets as typically seen in industry and smaller scale test sample soaking and found greater variation in DM reduction in the results of full sized haynet repeats. This suggests hay may not absorb water evenly throughout the net when large haynets are soaked. This would make it harder for industry individuals to accurately measure the DM intake of their animals which is critical when inducing weight loss through feeding.
Regardless of inconsistencies in the relationship between soaking time periods, moisture increase, and DM percentages, a decrease in DM was still observed when factoring in the range as well as medians of each soaking time period. This decrease is vital for equine owners and caregivers to understand as most diets are calculated on a DM percentage BW. If haynets are not weighed prior to soaking this could cause an added unintentional deficit in calories provided in the diet which could cause serious health implications for the animal (Argo, Dugdale, and McGowan, 2015).
Soaking effect on fibre content
Soaking hay resulted in a positive correlation between both NDF and ADF content and soaking duration. A significant increase (p = 0.004) was seen in both components; therefore, the alternate hypotheses were accepted, and the null hypotheses rejected. Changes in NDF content were characterised by a percentage increase of 14.83- 15.06% from hour 0 (see table 2). This is slightly greater than values observed in previous literature of 7.78-13.59% with hay soaked for 7-16 hours (Mack et al., 2014; Argo, Dugdale, and McGowan, 2015). The median NDF value of fresh hay (65.84%) coincided with those of these studies (64.76-68.40%) therefore differences in maturity of the sampled forage is not likely to be the root cause of disparities in percentage increases (Ragnarsson and Lindberg, 2008). ADF content results equated to an increase of 6.11-15.57% from fresh hay values on a DM basis (see table 2). The upper end of these values are consistent with those of previous research which reported 15.06-15.45% increase with 8-16 hours of soaking (Mack et al., 2014; Moore-Colyer et al., 2014; Argo, Dugdale, and McGowan, 2015). The corresponding soaking times from the current study (8-12 hours) were those found to elicit a significant increase compared to the 0- and 1-hour group (p = 0.004). The ADF percentages of fresh, pre- soaked hay (36.860% on an AS basis and 42.670 on a DM basis) were also remarkably similar to previously published data. Values of 37.39-38.38% have been found on a DM basis, despite differences in the hay type used and the demographic differences of hay sources (Mack et al., 2014; Argo, Dugdale, and McGowan, 2015). This suggests ADF content is influenced by plant maturity more than species variation and diurnal changes, contrary to other nutritional components such as WSC.
Percentage increases seen in both NDF and ADF components are likely to be caused by both increased fibre concentration and reduction of the non-structural components of forage (Collins, 1991). The observed reduction in DM is one explanation for fibre increases seen. Fibre components are measured in percentages, consequently, as total DM decreases, the values of structural components which have remained stable will still have a relative increase on a DM basis. While this would mean fibre portions have no impact on net energy consumption, it is beneficial for obese horses with large appetite requirements, as it enables greater chewing times without the added calorific content of feeding greater quantities of forage (Janis et al., 2010). There is conflicting research as to whether voluntary intake is affected by increased fibre content. Fleurance et al. (2009) reported fibre content of different forage types was not correlated to voluntary intake, however Edouard et al. (2008) suggested intake may have an inverse relationship with increasing NDF content, although individual variation was high. Considering this, the results of the current study could cause a decrease in the quantity of soaked hay consumed on a DM basis. However, ingestion of forage with a high fibre content is considerably slower than less mature sources (Muller, 2011). Subsequently, reduction in eating quantities is not likely to result in long periods without feed intake and may be beneficial in assisting gradual weight loss through the reduction in gross energy consumption.
The fibre portion of plants is primarily insoluble due to the lack of specific lignin degrading enzymes in the mammal digestible tract (Van Soest, 1963). Subsequently, the current findings suggest changes in the quantity of the ADF component may be a key element in successful reduction of total calorific content of hay. However, soaking has also been found to increase the digestibility of the ADF component of hay by 13.5% (Argo, Dugdale, and McGowan, 2015).
This is likely to be due to physical and chemical changes caused by the hydrophilic nature of cellulose (Chami Khazraji and Robert, 2013). These changes trigger disintegration of the plant cell wall structure and consequently allow greater accessibility for microbial digestion (Longland, Barfoot, and Harris, 2014). Without consideration of other components this would seem to increase gross energy availability and therefore cause soaking to be an ineffective method in reduction of forage energy availability. Despite this, Argo, Dugdale, and McGowan, (2015) found following correction of values based on DM loses all other nutrients were significantly reduced which resulted in a 23.5% loss in mean digestible energy intake compared with pre-soaked hay.
Soaking effect on water-soluble carbohydrate content
A significant inverse relationship was found between WSC quantity and soaking time; therefore, the alternate hypothesis was accepted, and the null hypothesis rejected. WSC concentrations were notably depleted at each soaking time period with maximum mean reduction occurring at 8 hours (-47.20%). These results are much greater than those found in previous research which identified a 27-37% reduction in WSC with soaking times between 7 and 16 hours (Longland, Barfoot, and Harris, 2011; Moore- Colyer et al., 2014; Argo, Dugdale, and McGowan, 2015). Differences in water and environmental temperature at time of soaking are one explanation of these results (Longland, Barfoot, and Harris, 2014). However, conditions set by Longland, Barfoot, and Harris (2011) involved higher mean temperatures (8°C) and longer soaking times than the current study but resulted in smaller percentage losses. Percentage losses of this study also more closely replicated summer reduction rates of Longland, Barfoot, and Harris (2014) which had a mean temperature of 16°C (30%, 33% and 46% reduction at 1, 3 and 16 hours respectively), than winter values which had a mean temperature of 8°C (12%, 15% and 28% at 1, 3 and 16 hours respectively). Differences in hay types and characteristics may also account for differences in losses irrespective of environmental conditions. Although the methodology and samples of this study did not allow for examination of this concept, the hay was not majorly course or leafy which suggests a medium cut. Results concurred with those of Mack et al. (2014) who reported a mean WSC reduction of 51.41%. However, hay type and soaking conditions were not controlled for in that study therefore similarities cannot be compared.
The significant differences (p = 0.028) found between the beginning (0-1 hours) and end (8-12 hours) of soaking, and middle (2- 4 hours) and end of soaking give insight into the time periods which may be necessary to elicit crucial depletion of WSC for reduction of caloric content of hay. Frank et al. (2010) suggested WSC content of less than 10% would promote weight loss. The current results show these levels can be achieved with soaking for 8+ hours, as medians presented equate to 16.77%, 8.15%, 10.15% and 10.49% for 0, 1, 2 and 4 hours respectively, and 7.51% and 7.16% for 8 and 12 hours. However, to understand specific concentrations in individual diets, hay samples from the hay population available to that horse would need to undergo laboratory analysis.
Limitations of the study
During the drying process preceding packaging and posting to the laboratories, not all samples were able to fit in the oven available to us at Hartpury Equine at once. This resulted in a lack of standardisation between samples in terms of their individual ratio of oven to air-drying time, and the order in which it was done. This is likely to be what caused the discrepancies in sample weight in the post drying phase. While this did not affect the laboratory ability to run all necessary tests and procedures, it may affect the validity and reliability of AS basis results. Consequently, DM significance values were focused on in analysis of results in order to both limit differences from drying variation and for ease of comparison with previously published data.
The small sample size could also be a limiting factor within the research as it leads to a greater standard of error which may lower the statistical power of the result (Hackshaw, 2008). The size of the sample population also increases the difficulty in distinguishing results caused by outliers and random variations as opposed to a real effect of the independent variable. This may have heightened or decreased the significance of some results in this work, however the use of non-parametric tests should limit the extent of this.
Areas of future research
Further research into the nutritional changes of commonly used hay species when soaked for 8-12 hours would allow more specific guidelines to be formulated. Longitudinal studies following horses’ weight loss progress when fed soaked hay at various percentage BW rates are also needed to gain insight into the practical and physiological implications of nutritional variation. This would provide a more evidence- based background for the use of specific hay soaking techniques as a weight loss approach. More conclusive research could also help governing bodies and educational organisations to create comprehensive guidelines surrounding this approach for more widespread distribution.
CHAPTER FIVE: CONCLUSION
This study set out to determine the soaking duration needed to significantly alter nutritional components of hay. Results of the study confirm decreases in DM and WSC content of hay and increases in ADF and NDF content when soaking for 1, 2, 4, 8, and 12 hours. Through statistical analysis a significant difference (p<0.05) was found in fibre and WSC content of hay at 8-12 hours of soaking compared to values at 0-1 hours. Consequently, it can be determined that a soaking duration of 8-12 hours should be sufficient to deplete WSC levels and increase fibre portions to levels which are currently recommended for healthy weight loss in horses. Further research analysing the weight loss achieved from different nutritional ratios would enable more precise weight loss programmes to be created. Research quantifying nutritional changes from soaking at the established duration in different grass species and environmental climates would also be required to create case specific energy calculated diets without the need for individual forage analysis.
REFERENCES
- Argo, C.M., (2009). Appraising the portly pony: body condition and adiposity. Vet J, 179, pp.158-60.
- Argo, C.M., Curtis, G.C., Grove-White, D., Dugdale, A.H., Barfoot, C.F. and Harris, P.A., (2012). Weight loss resistance: A further consideration for the nutritional management of obese Equidae. The Veterinary Journal, 194(2), pp.179-188.
- Argo, C.M., Dugdale, A.H. and McGowan, C.M., (2015). Considerations for the use of restricted, soaked grass hay diets to promote weight loss in the management of equine metabolic syndrome and obesity. The Veterinary Journal, 206(2), pp.170-177.
- Bamford, N.J., Potter, S.J., Baskerville, C.L., Harris, P.A. and Bailey, S.R., (2019). Influence of dietary restriction and low?intensity exercise on weight loss and insulin sensitivity in obese equids. Journal of veterinary internal medicine, 33(1), pp.280-286.
- Blackman, M. and Moore-Colyer, M.J.S., (1998). Hay for horses: the effects of three different wetting treatments on dust and nutrient content. Animal Science, 66(3), pp.745-750.
- Borgia, L., Valberg, S., McCue, M., Watts, K. and Pagan, J., (2011). Glycaemic and insulinaemic responses to feeding hay with different non?structural carbohydrate content in control and polysaccharide storage myopathy?affected horses. Journal of Animal Physiology and Animal Nutrition, 95(6), pp.798-807.
- Burk, A.O. and Williams, C.A., (2008). Feeding management practices and supplement use in top-level event horses. Comparative Exercise Physiology, 5(2), pp.85-93.
- Burton, G.W., Hart, R.H. and Lowrey, R.S., (1967). Improving Forage Quality in Bermudagrass by Breeding 1. Crop science, 7(4), pp.329-332.
- Chami Khazraji, A. and Robert, S., (2013). Interaction effects between cellulose and water in nanocrystalline and amorphous regions: A novel approach using molecular modeling. Journal of Nanomaterials, 2013.
- Collins, M., (1991). Hay curing and water soaking: Effects on composition and digestion of alfalfa leaf and stem components. Crop science, 31(1), pp.219-223.
- Coverdale, J.A., Moore, J.A., Tyler, H.D. and Miller-Auwerda, P.A., (2004). Soybean hulls as an alternative feed for horses. Journal of animal science, 82(6), pp.1663- 1668.
- Darlington, J.M. and Hershberger, T.V., (1968). Effect of forage maturity on digestibility, intake and nutritive value of alfalfa, timothy and orchardgrass by equine. Journal of animal science, 27(6), pp.1572-1576.
- Dougal, K., de la Fuente, G., Harris, P.A., Girdwood, S.E., Pinloche, E., Geor, R.J., Nielsen, B.D., Schott, H.C., Elzinga, S. and Newbold, C.J., (2014). Characterisation of the faecal bacterial community in adult and elderly horses fed a high fibre, high oil or high starch diet using 454 pyrosequencing. PloS one, 9(2), p.e87424.
- Dugdale, A.H.A., Curtis, G.C., Harris, P.A. and Argo, C.M., (2011). Assessment of body fat in the pony: Part I. Relationships between the anatomical distribution of adipose tissue, body composition and body condition. Equine veterinary journal, 43(5), pp.552-561.
- Durham, A.E., (2009). The role of nutrition in colic. Veterinary Clinics of North America: Equine Practice, 25(1), pp.67-78.
- Dytham, C. (2010) Choosing and using statistics: A biologist’s guide. 3rd edn. Wiley Blackwell.
- Edouard, N., Fleurance, G., Martin-Rosset, W., Duncan, P., Dulphy, J.P., Grange, S., Baumont, R., Dubroeucq, H., Perez-Barberia, F.J. and Gordon, I.J., (2008). Voluntary intake and digestibility in horses: effect of forage quality with emphasis on individual variability. Animal, 2(10), pp.1526-1533.
- Evans, J.G., Fraser, M.D., Owen, I. and Davies, D.A., (2011). An evaluation of two perennial ryegrass cultivars (AberDart and Fennema) for sheep production in the uplands. The Journal of Agricultural Science, 149(2), pp.235-248.
- Fields, A. (2017). Discovering statistics using IBM SPSS. SAGE Publishing.
- Fleurance, G., Fritz, H., Duncan, P., Gordon, I.J., Edouard, N. and Vial, C., (2009). Instantaneous intake rate in horses of different body sizes: influence of sward biomass and fibrousness. Applied Animal Behaviour Science, 117(1-2), pp.84-92.
- Francis, S.A., Chapman, D.F., Doyle, P.T., Leury, B.J. and Egan, A.R., (2002). Non- structural carbohydrate content of a perennial ryegrass cultivar bred for high sugar levels, compared to ‘normal’perennial ryegrass and white clover. Animal production in Australia, 24, pp.73-76.
- Frank, N., Geor, R.J., Bailey, S.R., Durham, A.E. and Johnson, P.J., (2010). Equine metabolic syndrome. Journal of veterinary internal medicine, 24(3), pp.467-475.
- Giles, S.L., Rands, S.A., Nicol, C.J. and Harris, P.A., (2014). Obesity prevalence and associated risk factors in outdoor living domestic horses and ponies. PeerJ, 2, p.e299.
- Gill, J.C., Pratt-Phillips, S.E., Mansmann, R. and Siciliano, P.D., (2016). Weight loss management in client-owned horses. Journal of Equine Veterinary Science, 39, pp.80- 89.
- Gilliland, T.J., Johnston, J. and Connolly, C., (2007). A review of forage grass and clover seed use in Northern Ireland, UK between 1980 and 2004. Grass and Forage Science, 62(3), pp.239-254.
- Glinsky, M.J., Smith, R.M., Spires, H.R. and Davis, C.L., (1976). Measurement of volatile fatty acid production rates in the cecum of the pony. Journal of animal science, 42(6), pp.1465-1470.
- Grabber, J.H., Ralph, J., Lapierre, C. and Barrière, Y., (2004). Genetic and molecular basis of grass cell-wall degradability. I. Lignin–cell wall matrix interactions. Comptes rendus biologies, 327(5), pp.455-465.
- Griffin, J.L., Wangsness, P.J. and Jung, G.A., (1980). Forage Quality Evaluation of Two Warm− Season Range Grasses Using Laboratory and Animal Measurements
- 1. Agronomy Journal, 72(6), pp.951-956.
- Hackshaw, A., (2008). Small studies: strengths and limitations. European Respiratory Journal, 32(5), pp.1141-1143.
- Harris, P.A. and Rivero, J.L.L., (2017). Nutritional considerations for equine rhabdomyolysis syndrome. Equine Veterinary Education, 29(8), pp.459-465.
- Harris, P.A., Ellis, A.D., Fradinho, M.J., Jansson, A., Julliand, V., Luthersson, N., Santos, A.S. and Vervuert, I., (2017). Feeding conserved forage to horses: recent advances and recommendations. Animal, 11(6), pp.958-967.
- Hudson, J.M., Cohen, N.D., Gibbs, P.G. and Thompson, J.A., (2001). Feeding practices associated with colic in horses. Journal of the American Veterinary Medical Association, 219(10), pp.1419-1425.
- Janis, C.M., Constable, E.C., Houpt, K.A., Streich, W.J. and Clauss, M., (2010). Comparative ingestive mastication in domestic horses and cattle: a pilot investigation. Journal of animal physiology and animal nutrition, 94(6), pp.e402-e409.
- Jung, H.J.G., Samac, D.A. and Sarath, G., (2012). Modifying crops to increase cell wall digestibility. Plant Science, 185, pp.65-77.
- Kauter, A., Epping, L., Semmler, T., Antao, E.M., Kannapin, D., Stoeckle, S.D., Gehlen, H., Lübke-Becker, A., Günther, S., Wieler, L.H. and Walther, B., (2019). The gut microbiome of horses: current research on equine enteral microbiota and future perspectives. Animal Microbiome, 1(1), pp.1-15.
- Longland, A.C. and Byrd, B.M., (2006). Pasture nonstructural carbohydrates and equine laminitis. The Journal of nutrition, 136(7), pp.2099S-2102S.
- Longland, A.C., Barfoot, C. and Harris, P.A., (2011). Effects of soaking on the water? soluble carbohydrate and crude protein content of hay. Veterinary Record, 168(23), pp.618-618.
- Longland, A.C., Barfoot, C. and Harris, P.A., (2014). Effect of period, water temperature and agitation on loss of water?soluble carbohydrates and protein from grass hay: implications for equine feeding management. Veterinary Record, 174(3), pp.68-68.
- Longland, A.C., Cairns, A.J. and Humphreys, M.O., (1999). Seasonal and diurnal changes in fructan concentration in Lolium perenne: implications for the grazing management of equines predisposed to laminitis. Proceedings: 16th Equine Nutritional Physiology Society, Raleigh, NC, pp.258-259.
- Luthersson, N., Nielsen, K.H., Harris, P. and Parkin, T.D.H., (2009). Risk factors associated with equine gastric ulceration syndrome (EGUS) in 201 horses in Denmark. Equine veterinary journal, 41(7), pp.625-630.
- Mack, S.J., Dugdale, A.H., Argo, C.M., Morgan, R.A. and McGowan, C.M., (2014). Impact of water-soaking on the nutrient composition of UK hays. The Veterinary Record, 174(18), p.452.
- McCue, M.E., Geor, R.J. and Schultz, N., (2015). Equine metabolic syndrome: a complex disease influenced by genetics and the environment. Journal of Equine Veterinary Science, 35(5), pp.367-375.
- McGowan, C.M., Dugdale, A.H., Pinchbeck, G.L. and Argo, C.M., (2013). Dietary restriction in combination with a nutraceutical supplement for the management of equine metabolic syndrome in horses. The Veterinary Journal, 196(2), pp.153-159.
- Menzies?Gow, N.J., Harris, P.A. and Elliott, J., (2017). Prospective cohort study evaluating risk factors for the development of pasture?associated laminitis in the United Kingdom. Equine veterinary journal, 49(3), pp.300-306.
- Moore-Colyer, M.J.S., Lumbis, K., Longland, A. and Harris, P., (2014). The effect of five different wetting treatments on the nutrient content and microbial concentration in hay for horses. PLoS One, 9(11), p.e114079.
- Morrison, P.K., Harris, P.A., Maltin, C.A., Grove-White, D., Barfoot, C.F. and Argo, C.M., (2015). Perceptions of obesity and management practices in a UK leisure-based population of horse-owners and enthusiasts. Equine Obesity: Concepts and Mechanisms, p.51.
- Muhonen, S., Sadet-Bourgeteau, S. and Julliand, V., (2021). Effects of Differences in Fibre Composition and Maturity of Forage-Based Diets on the Microbial Ecosystem and Its Activity in Equine Caecum and Colon Digesta and Faeces. Animals, 11(8), p.2337.
- Müller, C.E., (2011). Equine ingestion of haylage harvested at different plant maturity stages. Applied Animal Behaviour Science, 134(3-4), pp.144-151.
- Müller, C.E., Nostell, K. and Bröjer, J., (2016). Methods for reduction of water soluble carbohydrate content in grass forages for horses. Livestock Science, 186, pp.46-52.
- Ragnarsson, S. and Lindberg, J.E., (2008). Nutritional value of timothy haylage in Icelandic horses. Livestock Science, 113(2-3), pp.202-208.
- Rendle, D., McGregor Argo, C., Bowen, M., Carslake, H., German, A., Harris, P., Knowles, E., Menzies-Gow, N. and Morgan, R., (2018). Equine obesity: current perspectives. UK-Vet Equine, 2(Sup5), pp.1-19.
- Richards, N., Hinch, G.N. and Rowe, J.B., (2006). The effect of current grain feeding practices on hindgut starch fermentation and acidosis in the Australian racing Thoroughbred. Australian veterinary journal, 84(11), pp.402-407.
- Robin, C.A., Ireland, J.L., Wylie, C.E., Collins, S.N., Verheyen, K.L.P. and Newton, J.R., (2015). Prevalence of and risk factors for equine obesity in Great Britain based on owner?reported body condition scores. Equine veterinary journal, 47(2), pp.196- 201.
- Rodiek, A.V. and Jones, B.E., (2012). Voluntary intake of four hay types by horses. Journal of Equine Veterinary Science, 32(9), pp.579-583.
- Seppänen, M.M., Pakarinen, K., Jokela, V., Andersen, J.R., Fiil, A., Santanen, A. and Virkajärvi, P., (2010). Vernalization response of Phleum pratense and its relationships to stem lignification and floral transition. Annals of botany, 106(5), pp.697-707.
- Shepherd, M.L., Pleasant, R.S., Crisman, M.V., Werre, S.R., Milton, S.C. and Swecker Jr, W.S., (2012). Effects of high and moderate non?structural carbohydrate hay on insulin, glucose, triglyceride, and leptin concentrations in overweight Arabian geldings. Journal of animal physiology and animal nutrition, 96(3), pp.428-435.
- Simmons, H.A. and Ford, E.J.H., (1991). Gluconeogenesis from propionate produced in the colon of the horse. British Veterinary Journal, 147(4), pp.340-345.
- Smith, K.F., Simpson, R.J., Culvenor, R.A., Humphreys, M.O., Prud'Homme, M.P. and Oram, R.N., (2001). The effects of ploidy and a phenotype conferring a high water- soluble carbohydrate concentration on carbohydrate accumulation, nutritive value and morphology of perennial ryegrass (Lolium perenne L.). The Journal of Agricultural Science, 136(1), pp.65-74.
- Soest, P.V., (1963). Use of detergents in the analysis of fibrous feeds. II. A rapid method for the determination of fiber and lignin. Journal of the Association of official Agricultural Chemists, 46(5), pp.829-835.
- Soest, P.V. and Wine, R.H., (1967). Use of detergents in the analysis of fibrous feeds.
- IV. Determination of plant cell-wall constituents. Journal of the Association of Official Analytical Chemists, 50(1), pp.50-55.
- Sorensen, R.J., Drouillard, J.S., Douthit, T.L., Ran, Q., Marthaler, D.G., Kang, Q., Vahl, C.I. and Lattimer, J.M., (2021). Effect of hay type on cecal and fecal microbiome and fermentation parameters in horses. Journal of animal science, 99(1), p.skaa407.
- Stephenson, H.M., Green, M.J. and Freeman, S.L., (2011). Prevalence of obesity in a population of horses in the UK. The Veterinary Record, 168(5), p.131.
- Stowers, N.L., Waldron, L.A., Pryor, I.D., Hill, S.R. and O'brien, J., (2013). The influence of two lucerne-based forage feeds, FiberProtect® and FiberEdge® on Equine Gastric Ulcer Syndrome in horses. Journal of Applied Animal Nutrition, 2.
- Van Weyenberg, S., Hesta, M., Buyse, J. and Janssens, G.P.J., (2008). The effect of weight loss by energy restriction on metabolic profile and glucose tolerance in ponies. Journal of animal physiology and animal nutrition, 92(5), pp.538-545.
- Vermorel, M., Martin-Rosset, W. and Vernet, J., (1997). Energy utilization of twelve forages or mixed diets for maintenance by sport horses. Livestock Production Science, 47(2), pp.157-167.
- Vick, M.M., Sessions, D.R., Murphy, B.A., Kennedy, E.L., Reedy, S.E. and Fitzgerald, B.P., (2006). Obesity is associated with altered metabolic and reproductive activity in the mare: effects of metformin on insulin sensitivity and reproductive cyclicity. Reproduction, Fertility and Development, 18(6), pp.609-617.
- Virkajärvi, P., Saarijärvi, K., Rinne, M. and Saastamoinen, M., (2012). Grass physiology and its relation to nutritive value in feeding horses. In Forages and grazing in horse nutrition (pp. 17-43). Wageningen Academic Publishers, Wageningen.
- Watts, K.A. and Chatterton, N.J., (2004). A review of factors affecting carbohydrate levels in forage. J. Equine Vet. Sci, 24(2), pp.84-87.
- Wyse, C.A., McNie, K.A., Tannahil, V.J., Love, S. and Murray, J.K., (2008). Prevalence of obesity in riding horses in Scotland.
- By Hannah Kruger, Hartpury University, 2022
